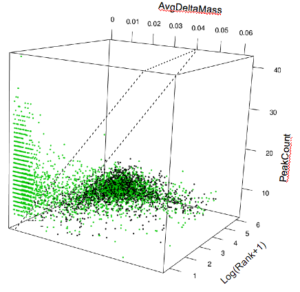
Figure 1: 3-D data-cube of S-score’s three components, with S-score=0 plane.
A scuba diver has a sophisticated dive computer on his wrist. But if disoriented, he would blow bubbles which he follows in slow ascent. The bubbles directly tell him: (1) which way is up, and (2) the safe ascent speed to avoid the bends.
That’s the success strategy amidst disorienting complexity: back to direct fundamentals.
Proteomics is robust for easy problems like identifying semi-pure proteins under ideal conditions, but it mostly struggles with clinically valuable low-abundance modified peptides (LAMPs) and proteins due to limitations in analytics. Here we illustrate how to identify labile phosphorylation with our novel hypothesis-driven methodology called SorcererScore(tm).
To be sure, the analytics is perhaps 90% there with the cross-correlation search engine (Eng et al, 1994), target-decoy search statistics (Elias and Gygi, 2010), and Bayesian protein inference (Keller et al, 2002) already integrated within the SORCERER GEMYNI platform.
The last 10% is its Achilles heel comprising peptide search and the post-search filter. Everything hinges on correct peptide ID of individual spectra, including protein ID, quantitation, and characterization of post-translational modifications (PTMs). Otherwise, everything downstream becomes garbage-in-garbage-out. We now know many irreproducible results can be explained by “p-hacking” (more later).
In any case, the challenge is to incorporate accurate fragment mass with statistical rigor, a deceptively tricky problem. After two years of stealth development with twists and turns, we believe we’ve solved this ‘massive’ puzzle by using high school math on direct fundamentals, i.e. mass accuracy.
The patent-pending SorcererScore analytics (Chiang, 2016) is technically compatible with all high-accuracy tandem mass spectrometers regardless of technology or brand, needing only accurate mass data. This automated software capability has been delivered to customer sites.
The impact of the 3 R’s of deep proteomics — robust, rigorous, and reproducible — to revolutionize all molecular biology research cannot be overstated. SorcererScore makes it possible for the very first time.
Plane simple data analysis
To visualize any set (or subset) of search engine results, each peptide ID “hypothesis” is mapped to a point within a 3D data-cube corresponding to: (1) composite delta-mass, (2) number of matched fragment peaks, and (3) the score rank.
For simplified illustration, figure 1 above shows a typical 3D data-cube after SorcererScore enrichment that yields the best hypothesis for each spectrum. The ‘correct’ cluster, almost all non-decoys (green), is where you expect: small delta-mass, large peak-count, and highly ranked scores [i.e. small log(Rank+1)]. The ‘incorrect’ cluster comprises roughly 50/50 decoys and non-decoys separated from the ‘correct’ cluster.
For the geometry-minded, a figure-of-merit (“S-score”) for each hypothesis is calculated as a linear combination of the three dimensions. It can be visualized as a family of parallel “S-score = X” planes tilted in a way that best partitions the correct-vs-incorrect clusters. For example, selecting peptide IDs at FDR~1% means sliding the plane orthogonally, corresponding to picking the S-score cutoff, such that only about 1% of the points above the plane are decoys.
Notably corrupt datasets, which can be up to one in 10 experiments, would be missing the “correct’ cluster.
Scanning for labile phosphorylation
We illustrate the concept behind SorcererScore with visual analysis of a clinically important PTM. Labile phosphorylation of serine/threonine is handled poorly if at all by current workflows. The problem is its instability during measurement, which can cause a mass loss of 98 amu (= 80 + 18 for the phosphate group plus water).
Here we turn this problem into a solution by using it as guide-post for three types of correct peptide IDs centered around 3 precursor delta-masses:
-
Non-labile modifications (dMass~0)
-
Single labile phosphorylation (dMass~+98)
-
Double labile phosphorylation (dMass~+196)
Note that a mass loss means a positive “dMass = Measured – Actual”, where ‘Measured’ is the reported ‘MS1’ mass from the raw data.
For illustration we do a target-decoy cross-correlation search using a large mass tolerance (+/- 1000 amu) with variable modifications {M +18; STY +80; ST -18}, while keeping the top 200 peptide ID hypotheses per spectrum. For our small anonymous phospho-peptide dataset (~5.8K spectra), this brute-force search took less than 15 hours on a SORCERER-2 iDA. This dataset was from a Thermo Q-Exactive, but any tandem mass spectrometer with accurate precursor and fragment mass would work.
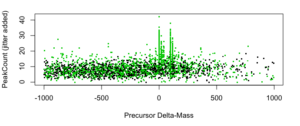
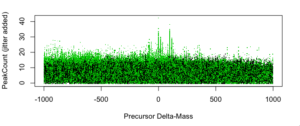
To generate our plots, we map each of ~1M hypotheses to a 2D point: (x,y) = (dMass, PeakCount) colored black (decoy) or green (non-decoy). Jitter is added to PeakCount to help visualize integer values.
Figure 2: PeakCount vs. Delta-Mass [amu] for top-rank peptide IDs.
For a gross overview, we plot “PeakCount vs. dMass” for just the 5.8K top-rank IDs (see figure 2 above). It shows intriguing patterns, but for now we are only interested in dMass around 0, +98 amu, and +196 amu.
Basic target-decoy statistics suggestg robust populations of top-ranked correct IDs at 0 and +98, but not necessarily at +196.
Figure 3: PeakCount vs. Delta-Mass [amu] for top 200 peptide IDs per spectrum.
Figure 3 above shows the full plot with all ~1M points including low-ranked IDs. It includes “shadow points” from search artifacts and replicated backbones (akin to isotopic peaks in mass spectrometry). Importantly, it includes valuable low-abundance peptides that need to be data-mined.
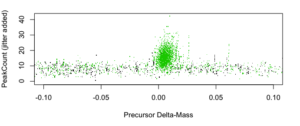
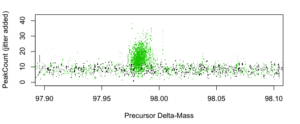
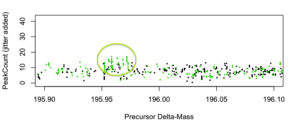
Figures 4, 5, and 6 below are simply zoomed-in views of figure 3 around 0, +98, and +196, respectively.
Figure 4: PeakCount vs. Delta-Mass [amu] for dMass~0 (non-labile modifications).
Figure 5: PeakCount vs. Delta-Mass [amu] for dMass~98 (single labile phosphorylation).
Figure 6: PeakCount vs. Delta-Mass [amu] for dMass~196 (double labile phosphorylation). Possible signal is highlighted.
Visually, there is strong evidence for robust comparably-sized populations of non-labile PTM IDs (~0) and single-labile phosphorylation (~98), and some evidence for a few double-labile phoshorylations (~196).
Notably, we deduce these qualitative conclusions just by plotting raw search results. SorcererScore quantitatively reports these IDs using the S-score that includes the 3rd dimension of score-rank.
That’s big-data analytics in action: Simple mathematical transformations on a large scale to reveal data patterns. The secret is to avoid complex models and a priori assumptions so as to let the shy data reveal thyself.
Note that we are looking to explain vertical patterns along a mass-based x-axis — just like raw mass spectrometry! Indeed, this can be viewed as a ‘MS0’ scan of raw search results, which is a higher level than a MS1 scan.
Possibly lost amidst the interpretive simplicity is the need for a capable analytics platform, including a cross-correlation search engine system that can run big searches with many PTMs.
A typical 100K-spectra dataset generates 20M hypotheses that need to be data-mined to enrich the <20K (0.1%) correct ones. Where results quality is critical, this is a game of mathematical subtlety and high-performance computing ill-suited for amateur programming.
P-hacking kills credibility
Conversely, if the analytics is from a speedy PC program, then its quality is most certainly questionable. And if it’s priced cheaply, that pretty much proves it. That’s the No-Free-Lunch principle. No one who understands deep data skimps on analytics.
Unfortunately, such programs became a de facto standard because p-hacking makes them fast and cheap and give seemingly amazing results. They fool researchers without solid math or computing understanding who over-trust their gut not their brain (perhaps forgetting what comes out of the gut). Unique within science, proteomics has been promoted as not requiring hypotheses nor data interpretation skills. This crisis aka opportunity arises because the deceptively tricky analytics looks trivial to casual observers in charge of funding.
“When a measure becomes a target, it ceases to be a good measure.”
– Goodhart’s Law
P-hacking is hacking the calculation of statistical significance, commonly the p-value, in order to boost weak results for publication. It has its own Wikipedia page and recently became a subject of comedian John Oliver’s HBO show.
A simple illustration: To measure if a coin might be biased, flip it 20 times to see if Heads and Tails are roughly even. To insinuate a fair coin might be biased, keep flipping it until you get 20 flips that support your desired conclusion, then just report that. On a computer, you keep looping to get any p-value you want by exploiting random variance.
In proteomics, FDR can be hacked by deliberately filtering out more decoys than non-decoys. This is a no-no per fundamental target-decoy statistics that “#CorrectIDs = #Targets – #Decoys”. Clearly, the total correct ID count can only be the same or reduced, but never increased, with each filtering operation, but biased filtering can make it appear increased.
P-hacked analytics increases apparent correct IDs and reduces apparent FDR by purposely confusing noise as signal. It is ideal for demos but detrimental to real research. Labs can sanity-check their analytics by tweaking software parameters on the same dataset, or use known corrupt data, to see if the results change drastically for no legitimate reason.
Mr. Oliver explains p-hacking is natural consequence of medical research in a publish-or-perish system, which allows grants and careers to keep moving in between rare true discoveries. In his view, the problem is the unaware public media that foolishly interpret individual published papers at face value.
It’s one thing for a PI to occasionally p-hack so his student or postdoc can move on. Besides, grant agencies understand the game and continue to fund him.
The implications are more serious for a proteomics lab, however, because p-hacked analytics means every lab result is basically semi-random. Labs seem to be unaware of this problem and stand to lose credibility and financial support from PI’s hurt by such results.
However, we hope the young technologists pressured to publish algorithm papers quickly don’t get scapegoated. Their work helped sparked our LAMP ideas. Academics don’t have our luxury of being able to work in secret for 2 years to get it right.
Trust data not intuition
Deep data analysis is really hard because intuition fights rigor. Good and bad, human intuition is wired for snap conclusions using hidden assumptions. Many proteomic scientists harbor data analysis assumptions outdated since the 1990’s when data was still shallow and did not need client-server computing.
Almost every educated person asked get the following question wrong:
True or false: “It is possible for >80% of the people to be above average.”
Detailed answer: No one has 3 eyes but a few are blind, so the average eyes/person is slightly below 2. Therefore, if you read with both eyes, congrats for being the >99% above average!
Or take physics. Most non-physicists don’t really believe Einstein’s special theory of relativity despite decades of data. The weirdness is that, in everyday experience, speed seems to be relative to whether the observer is moving toward (faster) or away (slower) from a moving object, while time seems absolute. But all the data show the speed of light in a vacuum is an absolute constant regardless of relative motion. In other words, it doesn’t matter if you are moving toward or away from a light source in space. Weird but that’s data.
In any case: “Speed = Distance/Time”, so if Speed is an absolute, then both Distance and Time must be relative! QED. Indeed, the 4-dimensional space-time continuum becomes a necessary and obvious conclusion because Distance and Time, linked by a universal constant, are really kind of the same thing.
So the conclusion is simple and rigorous, but intuition keeps many from accepting it.
The point is, untrained intuition is dangerously misleading in science. The above shows it can make right answers seem wrong. In proteomics, it makes wrong answers seem right.
Over two decades, proteomic analytics evolved along two parallel tracks — “hard-science” vs. “soft-science” — that derived information from first principles vs. corner-cutting models. Before modern mass spectrometers became available, their results were qualitatively similar (remember those Venn diagrams??), so the practical difference was more philosophical than technical.
Everything changed with two orders of magnitude improvement in mass accuracy, but the analytics fundamentally didn’t. In fact, the soft stuff got way worse. To make a long story short, hard-science workflows should have taken over the now-hard science of proteomics.
Instead, deceptive demo-quality analytics took over. These new tools made labs look like they could do no wrong, always reporting abundant IDs at super-low FDR no matter what, sometimes with more IDs than spectra, even on junk data.
Like booze at a frat party, p-hacked analytics fueled over-exuberance and helped $M mass spectrometers fly off the shelf. The adults in analytics were harshly criticized for being incompetent amateurs, and lost grant support because their tools would not identify 2 or 3 or 4 IDs/spectrum that labs believed they wanted.
P-hacked analytics conquers one’s intuition the same way fortune tellers fool their marks: Tell people just enough facts they can verify and they will believe everything they can’t verify. Clearly secrecy of method is part of the trick. That’s why savvy scientists avoid opaque analytics regardless of convincing demos. In our reverse-engineering study, one popular unpublished software has decent quality but was probably deemed too simple to publish. In our view, opaque analytics is not science and has no place in medical research impacting our mothers and sons.
Proteomic renaissance
Proteomics had long been held back by inadequate analytics. Low-end tools give semi-random results, while the high-end tools have not handled labile PTMs or low-abundance that PI’s need.
SorcererScore is a significant analytics breakthrough that solves both with a rigorous, hypothesis-driven workflow.
SorcererScore is exclusively available on SORCERER iDA systems. We will also explore analysis-as-a-service on a limited basis to help labs justify a purchase. Once available, LAMP capability will become a must-have standard for all proteomics labs.
Please contact Terri (Sales@SageNResearch.com) for information on SorcererScore and SORCERER iDAs.
References
A probability-based approach for high-throughput protein phosphorylation analysis and site localization.
Beausoleil SA, Villén J, Gerber SA, Rush J, Gygi SP.
Nat Biotechnol. 2006 Oct;24(10):1285-92. Epub 2006 Sep 10.
PMID: 16964243
How to Identify Low-Abundance Modified Peptides with Proteomics Mass Spectrometry.
Chiang, D.
Sage-N Research, Inc. White Paper SorcWP101A. 2016 May 5.
Target-decoy search strategy for mass spectrometry-based proteomics. Elias JE, Gygi SP. Methods Mol Biol 604 55-71 (2010)
An Approach to Correlate Tandem Mass Spectral Data of Peptides with Amino Acid Sequences in a Protein Database.
Eng JK, McCormack AL, Yates JR.
J Am Soc Mass Spectrom. 1994: 5 (11): 976–989. doi:10.1016/1044-0305(94)80016-2. PMID 24226387
Empirical statistical model to estimate the accuracy of peptide identifications made by MS/MS and database search.
Keller, A; Nesvizhskii, A.; Kolker, E; and Aebersold, R Analytical Chemistry, 74(20): 5383-5392. OCT 15 2002.

2 Comments
Leave your reply.