We recently discovered a surprisingly fast and robust method for raw spectra analysis (RSA). For the first time, it allows clinically important LAMPs (low abundance modified peptides) to be characterized at the raw data limit.
The breakthrough: Figure 1 shows average y-ion accuracy can approach 0.001 amu (m/z) — which allows analysis of the smallest peaks.
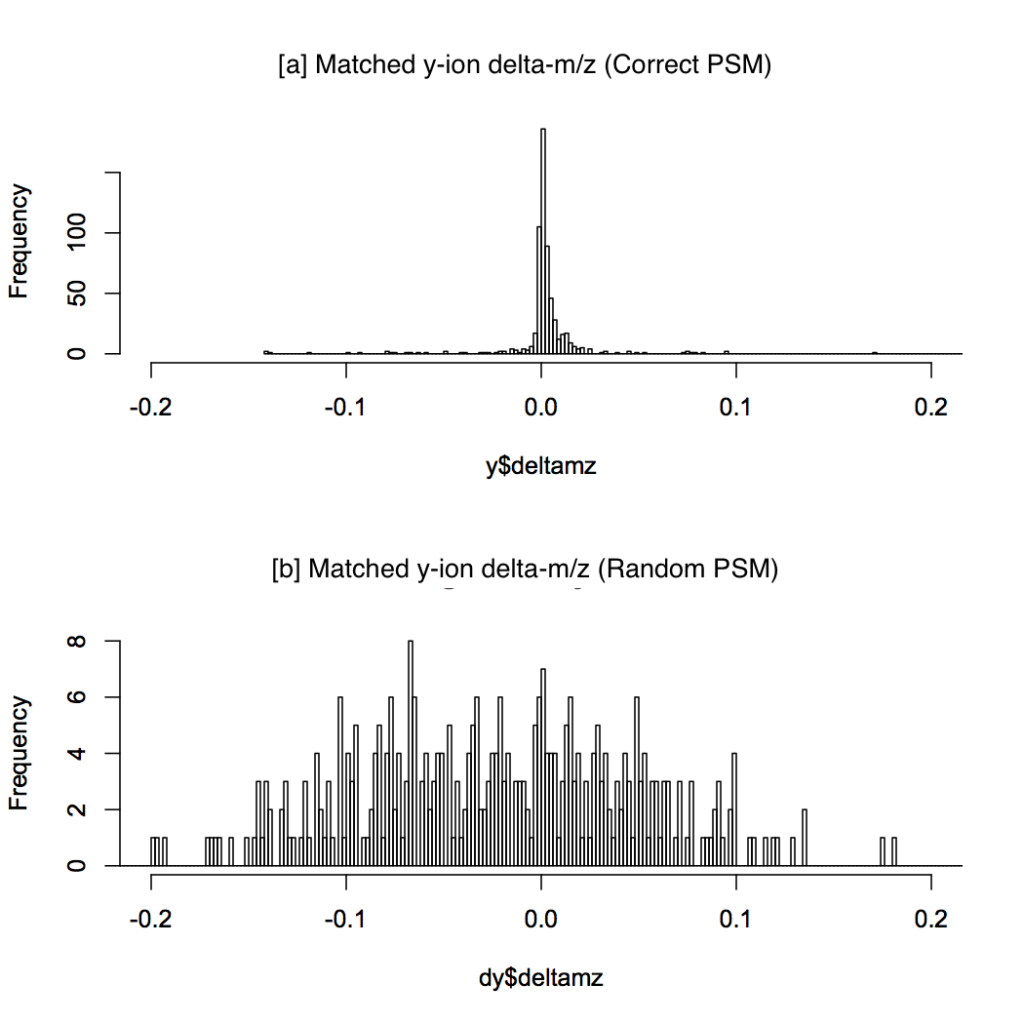
Figure 1: Distribution of y-ion delta-m/z errors for 80 correct PSMs (a) and 80 random PSMs (b).
New SorcererScore™ RSA searches at true data accuracy (<2 ppm) while retaining 200 search results (PSMs) to include any low-score LAMPs. A customizable script (SX1503) uses multi-dimensional analysis [explained here] to produce a CSV file of top PSMs based on y-ions. It can be mined directly in R or Excel, or automatically exported to TPP and Scaffold software.
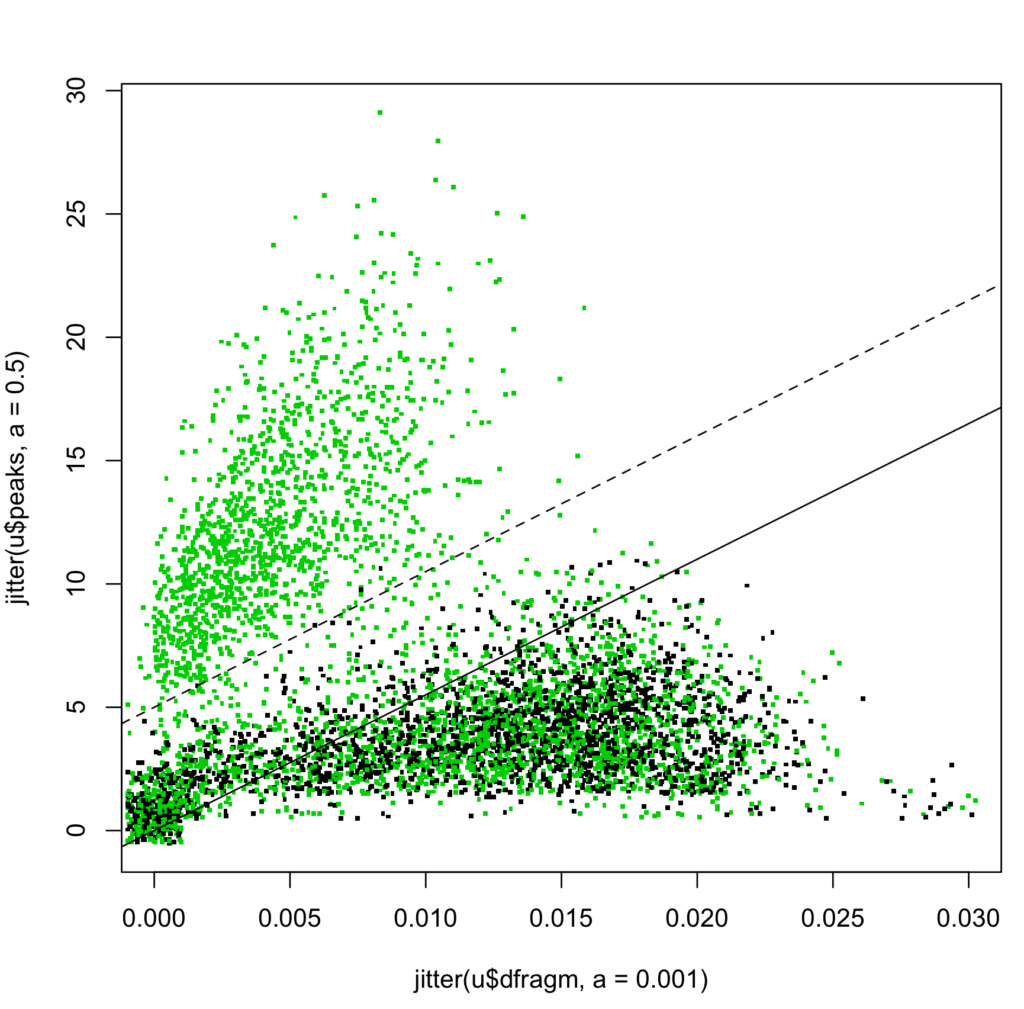
Figure 2: Fragment peaks vs. average delta-m/z scatterplot of top search score PSMs. [Jitter added to visualize quantized values.]
Real-world throughput is ~500 spectra/minute (with 5 mods) for a developer VM on a MacBook. Production SORCERERs can be scaled to process 100GB’s of data per hour such as out of ion mobility instruments.
We believe SorcererScore is the first and only precision workflow where raw m/z data are directly used to discriminate peptide IDs among search results (Figure 2). Other workflows instead use statistical models which make them imprecise at best.
In any model-based “soft” science, rigor is defined by its mathematics. Early models like PeptideProphet were rigorous. But the last decade saw an avalanche of homemade concepts that create a twilight zone blending reality with fantasy. For example, widely used “probability scores” are really non-rigorous p-values that interpolate solid yes/no answers with a semi-random continuum. This field has proved too-quick to incorporate innovative half-baked research to generate irreproducible results.
Mass spec labs are really tech startups that digitalize biochemistry as exponentially large m/z puzzles solved by computer-aided experts. More than mere semantics, being an information science means winning through exponential productivity. But the field neither understood nor funded IT, creating a productivity vacuum. This is a unique opportunity.
We believe SorcererScore RSA changes the game, and possibly triggers a research revolution, by positioning mass spectrometry as an accelerator of precision medicine and of technologies like CRISPR and immunotherapy.
Ask us about doing precision hard science with SORCERER™ starting at under $10K. We also have developer licenses available at no cost to academic technologists.
Foundation is y-ion accuracy
Our sample dataset comprises 5767 mass spectra acquired on a Thermo Fisher Q Exactive mass spectrometer, courtesy of Dr. Marcus Smolka (Cornell).
The nitty-gritty details: We do a target/decoy, 2 ppm (allowing mass error of +97.97 amu for phosphor/water loss), classic Yates-Eng XCorr search against tryptic Yeast peptides (allowing 3 missed digests) with 5 mods for phosphorylation and SILAC (M +~16; STY +~80; ST -~18; K +~8; R +~10) retaining 200 PSMs per spectrum. [For the principles of searching labile PTMs on SORCERER, click here.]
Figure 1 compares the distribution of y-ion delta-m/z error from 80 correct and 80 random PSMs. For each predicted +1 y-ion, the closest fragment peak within 0.3 amu (m/z) tolerance is considered.
Interestingly, no b-ions were definitively detected, which alleviates the aliasing (false match) problem.
“How can we visualize raw search results?”
Looking at just the top search score PSMs for each spectrum, we map each to a (x,y) point in a 2D scatterplot (Figure 2), colored green/black for target/decoy, respectively.
It is remarkably information-rich, precise (to 0.001 amu), and intuitively interpretable even for untrained eyes. (In contrast, most researchers have no intuition on scores.)
We can draw a dotted line (slope=550, y-intercept=5) that visually separates correct-vs-random clusters. To create a one-dimensional score for workflow automation, we define the S-score (a “discriminant score” in common parlance) as the vertical distance to its parallel (solid) line through the origin:
S-score = peaks – 550*dfragm .
Figure 3 shows the S-score distribution with a clear bimodal pattern.
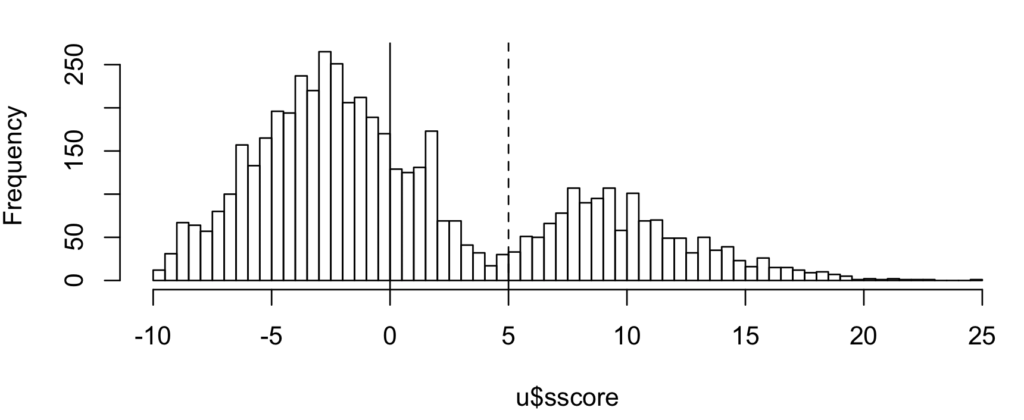
Figure 3: Distribution of S-score for top search score PSMs showing bimodal populations. Shown lines match those in figure 2 scatterplot.
By the target-decoy model, the number of correct IDs is roughly the count difference between target and decoy PSMs in any region. That means there are roughly 1564 correct IDs (3630T, 2066D) total, of which 1372 (1375T, 3D) or 88% are above the dotted line at ~0.2% FDR (=3/1375).
“How can we pick out LAMPs with low search scores?”
The S-score can be used to promote the one best PSM among 200, reflecting the biggest outlier in terms of matched fragment peaks.
We hypothesize total correct IDs should increase. In addition, correct abundant peptide IDs would remain unchanged, some LAMPs would be elevated (from low to top rank), and random PSMs would be replaced with other random PSMs.
Figure 4 shows the new 2D scatterplot.
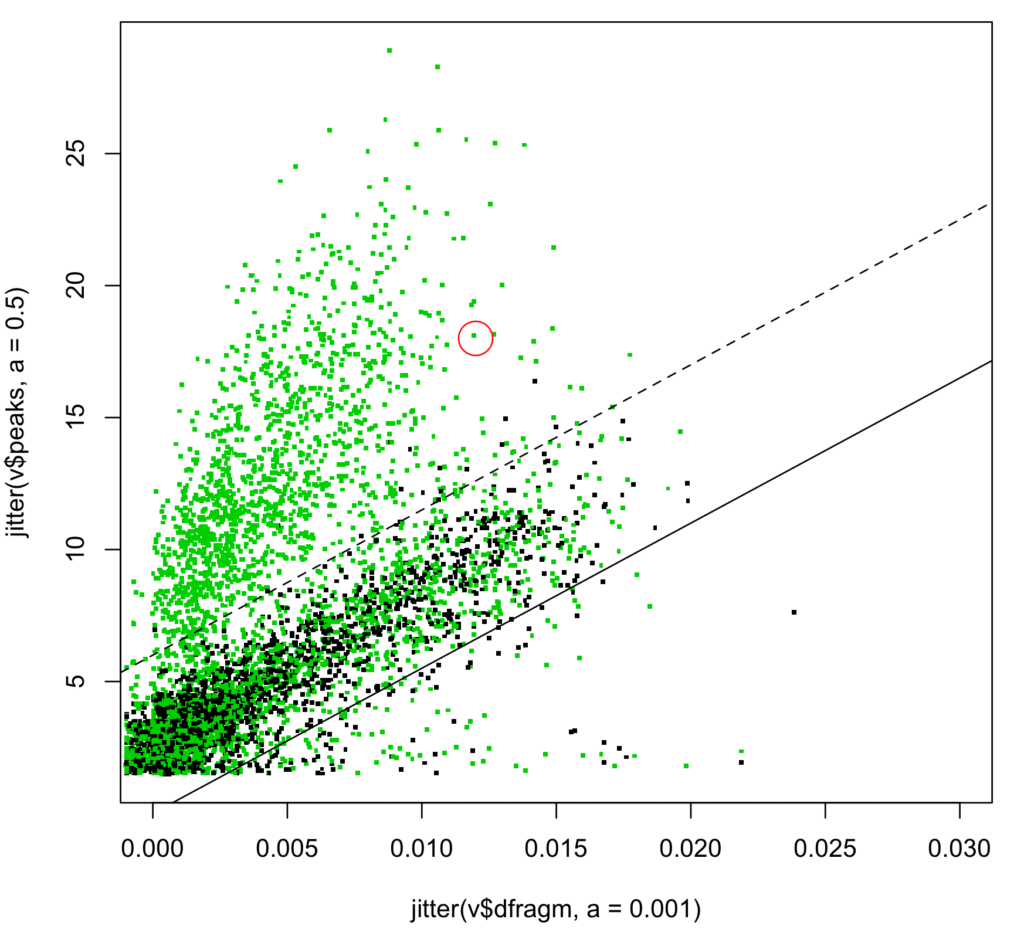
Figure 4: Distribution of S-score from top S-score PSMs. One solid LAMP is highlighted (see text).
Estimated correct IDs increased 5.1% from 1564 to 1644 (3637T, 1993D). Above the same dotted line (S-score >= 5), correct IDs increased 6.8% from 1372 to 1466 (1509T, 43D) presumably from LAMPs, though at 2.8% FDR. Increasing the S-score cutoff would reduce the FDR.
Higher S-score decoy PSMs likely reflect correct sequences outside the search space (either sequence or modification) but with significant c-terminus sequence homology.
Figure 5 is the new S-score distribution.
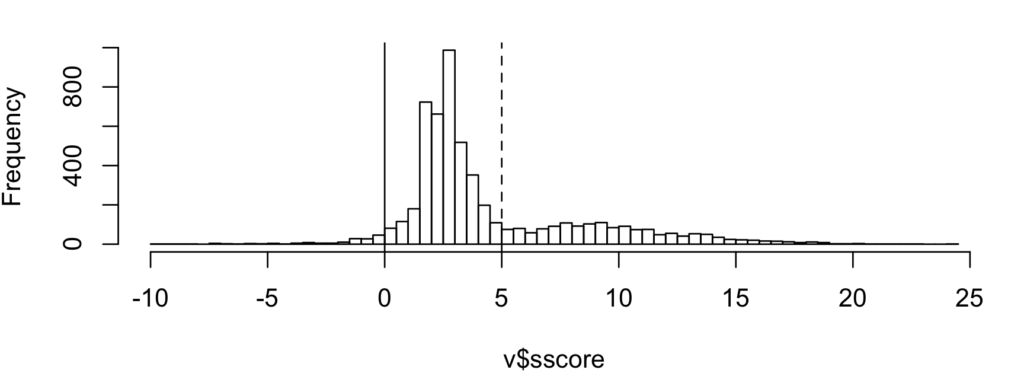
Figure 5: Distribution of S-score of top PSMs.
Figure 6 plots “S-score vs. XCorr Rank” including one highlighted deep LAMP elevated from search rank=152. It shows regions of abundant peptides near rank=1, shallow LAMPs with rank >10, and a few deep LAMPs with very low ranks including one highlighted and discussed below.
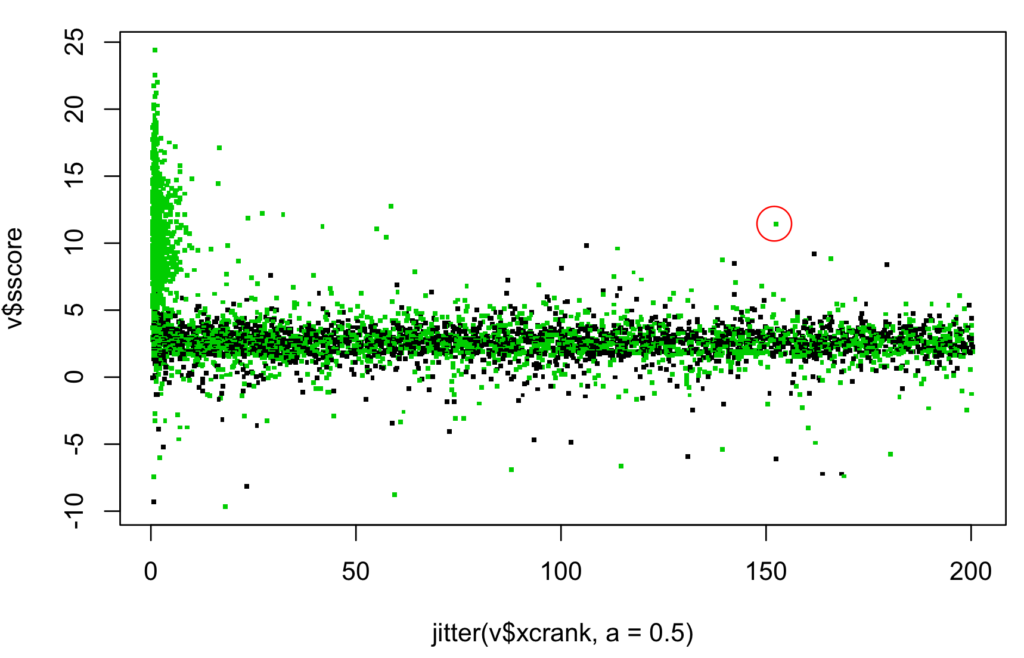
Figure 6: S-score vs. search score rank for top S-score PSMs. Same 152nd rank LAMP is highlighted.
Drill down to one LAMP
For clinical research, >99% of the data is incidental. We can use the 2D scatterplot as a “treasure map” to drill down to specific peptides/proteins in the main CSV file.
In our example we study the protein “PCL6” implicated by the highlighted deep LAMP in figures 4 and 6.
The +4 charged, 41-residue peptide has 2 intact phospho-sites (#) plus 1 phospho-site after water loss (@) with sequence (./: denotes +1/+2 y-ions):
“DIVVVTRVAS#E:E:T:L:E:S#QS:S@TSS:MG:IRP.E.S.S.F.N.YED.A.S.N.QAR”.
Its high ID confidence is suggested by its solid S-score=11.45 (dfragm=0.012, peaks=18) with good coverage from y3 to y30. Its long length at 2 ppm mass tolerance adds confidence.
Yet its low search score (XCorr=1.8763) at low rank (152nd among PSMs) suggests it may be missed in conventional workflows.
For SILAC quantitation, we can look at the raw precursor MS1 map (time, m/z).
For this +4 charged, three-arginine “light” peptide at (mono) m/z=1180.01, we expect to find two isotopic clusters spaced exactly 3*10/4 = 7.5 m/z apart at (z=4, m/z=1180.01 and 1187.51).
Figure 7 shows the relevant subset, with each digit denoting a relative intensity at log2 scale (i.e. +1 means 2x intensity). It highlights a maximal MS1 scan from which a pair of maximal intensities can be selected to calculate the heavy/light ratio. Coincidentally, each of light and heavy clusters overlaps with an unrelated cluster, thus illustrating the aliasing challenge for MS1 quantitation using calculus-based area-under-curve calculations. (For clarity, only m/z at 0.25 amu intervals are shown.)
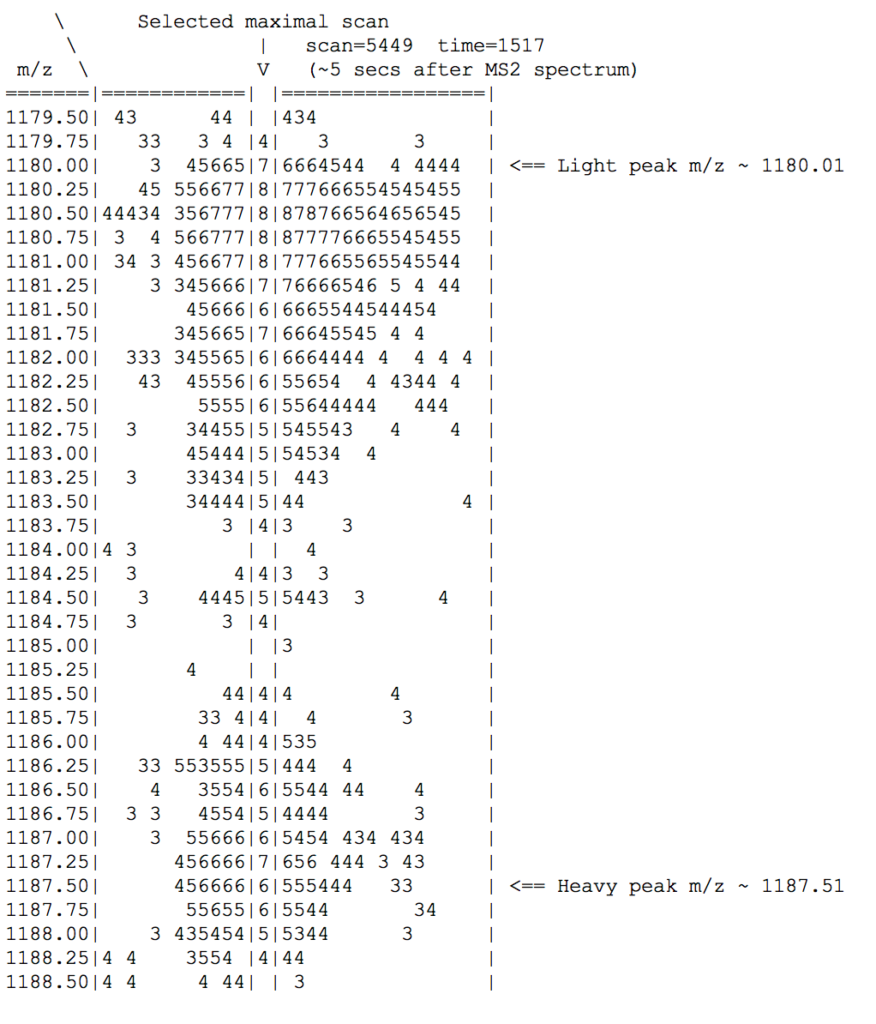
Figure 8: MS1 map showing SILAC light/heavy isotopic envelopes. See text for additional info.
For supporting data, we look for a +5 version of the SILAC pair (z=5, m/z=944.21 and 950.21). There is such a pair (not shown) with a generally similar ratio, adding confidence to both the pairing and quantitation.
RSA workflow in a nutshell
-
Gross-guess 100+ peptide ID hypotheses (PSMs) with a sensitive search engine at 2 ppm tolerance including all chemical modifications.
-
Optionally drop illegitimate PSMs (for handling motif-based modifications like glycosylation) and add de novo or derivative PSMs.
-
Distill to one best hypothesis as furthest 2D scatterplot outlier from y-ions within 0.03 amu.
-
Distilled hypotheses are accepted/rejected as peptide IDs. Core labs can use a global FDR cutoff. Clinical researchers can drill down to specific pathway proteins.
-
Peptide quantitation is estimated from one pair of raw m/z peaks, from either MS1 (SILAC, label-free) or MS2 (isobaric labels) data. [In other words, arithmetic in lieu of calculus for robust and verifiable LAMP quantitation.]
-
Protein quantitation is by default inferred from its longest peptide.
-
Researchers can interactively refine/validate any result by tracing directly to raw data.

Leave a Reply
Send Us Your Thoughts On This Post.